In the first of a series of planned articles on opinion polling and politics around Europe, I’ll examine the polling and political situation in Sweden during the period of January 2012 through to January 2014.
1. Political overview
In the aftermath of the Swedish General election of 2010 the Riksdag(Swedish Parliament) was divided amongst eight distinct parties and three distinct camps. These parties included amongst them the following:
- Sveriges Socialdemokratiska arbetarparti(Swedish Social Democratic Workers’ Party, SAP, [2010 Result:30.66%,112 seats]) – (Electorally as: Arbetarepartiet-Socialdemokraterna)
- Moderata samlingspartiet (Moderate Party, M, [2010 Result:30.06%,107 seats])
- Miljöpartiet de Gröna (Green Party, MP, [2010 Result:7.34%,25 seats])
- Folkpartiet Liberalerna (Liberal People’s Party, FP, [2010 Result:7.06%,24 Seats])
- Centerpartiet (Centre Party, C, [2010 Result:6.56%,23 Seats])
- Sverigedemokraterna (Sweden Democrats, SD, [2010 Result:5.70%,20 Seats])
- Vänsterpartiet (Left Party, VP, [2010 Result:5.60%,20 Seats])
- Kristdemokraterna (Christian Democrats, KD, [2010 Result:5.60%,19 Seats])[1][2]
The Moderate Party, Centre Party, Liberal People’s Party and Christian Democrats together form the Alliansen, which is the current governing bloc in Sweden, and control a collective total of 173 of the 349 seats in the Riksdag; they, as can be seen, were short of the majority point of 175 seats. In opposition to the Alliansen is De rödgröna, an alliance of the Social Democrats, Green Party and Left Party; De rödgröna controls 156 seats in the Riksdag. The third camp in the Riksdag are the Far-right Sweden Democrats who, owing to their perceived extremism, are without any allies in the Riksdag so sit alone with their 20 seats.
2. Electoral system overview
In Sweden, the electoral system is an open party list with 310 seats divided amongst 29 constituencies, based for the most part on the counties of Sweden but with the larger counties being split up into smaller units. On top of the constituency seats there are 39 adjustment seats at national level, which are divided amongst the parties based both on the total number of votes received nationally and the amount of seats won at constituency level. Allocation of seats at all levels is determined according to the modified Sainte-Laguë method, a form of highest averages method not too dissimilar to D’hondt, but widely recognised in its unmodified form to be ‘fairer’ than D’hondt; in its modified form it performs much the same as D’hondt. Parties are subject to two different sets of ‘thresholds’ during an election to the Riksdag; a 4% threshold applies nationally which, if achieved, entitles parties to participate in the distribution of seats at both the constituency level and the national adjustment level, and a 12% threshold applies at the constituency level for parties not reaching the 4% national threshold, if this is achieved, a party is entitled to participate in the seat distribution for that constituency.[3]
3. Opinion polling overview
In Sweden opinion polls are carried out by a number of different commercial organisations including TNS-Sifo, Novus, Yougov, Sentio, Ipsos, Skop, Demoskop and United Minds. In addition to those ‘pollsters’, there are biannual ‘mega-polls’ conducted by Statistics Sweden (SCB), Sweden’s national statistics agency. Most of these pollsters conduct opinion polls on a regular monthly basis, though that regularity is somewhat disrupted by the summer, which I gather is something of a go-slow time for Sweden, in a way not generally replicated in other countries.
Special attention will be given to the polls conducted by the SCB which, while few in number, are of a quality rarely seen in the world given that they are both conducted by an impartial public statistics agency and have samples of 9,000 or so which is much, much larger than the usual sample sizes in Ireland of 1000, or indeed even the larger samples of 2500 favoured in a country like Germany. Generally for most Swedish opinion polls there exists the same caveats that exist for polls conducted in a country like Ireland, namely a lack of total transparency on the part of commercial pollsters and the higher margins of error seen on polls of the relatively small size of 1000 people; the maximum margin of error on a poll of 1000 is 3.1% in comparison to the 1.03% on SCB’s polls of 9,000. Given the margins of error we will restrict ourselves to looking at aggregated monthly averages which are more likely to smooth out the errors present in any individual poll issued in any individual month; though when necessary we will make reference to specific polls. I’ve taken every effort I can to make sure than I’ve recorded every opinion poll conducted in Sweden during the time period in question, but, as I’m not a speaker or reader of Swedish it needs to be taken into consideration that I might have missed a few polls.
TABLE ONE: Monthly polling averages January 2012-December 2012

4. Opinion Polling January 2012 to December 2012
2012 started in Swedish politics with the Social Democrats and their bloc polling weakly against the Moderate Party and the Alliansen. The Social Democrats, who have historically enjoyed support in the high thirties and forties, achieved a remarkably low figure of 24.1% in the average for January, while their bloc was only boosted to 43.6% by the performances of the Green Party with their 12.0% and the Left Party with its 7.5%. By contrast the Moderates enjoyed 34.4%, a very high figure for them historically, though their Alliansen allies were not enjoying such success with the Liberal People’s Party, Centre Party and Christian Democrats all polling below their 2010 General election results with the Christian Democrats being below the 4% needed to get seats in the Riksdag with 3.4%; the Alliansen as as whole secured a total of 48.9% in January.
This languishing for the Social Democrats in the polls was attributed widely to the general unpopularity of their leader Håkan Juholt who promptly stepped on his sword and resigned as leader towards the end of the month;[4] Juholt’s replacement was trade unionist Stefan Löfven[5] whose appointed seemed to steady the Social Democrat’s ship seeing them rise upwards to 26.9% in February, 31.5% in March and high points in April, May and June of 35.3%, 35.5% and 35.3% respectively. For the Social Democrat’s allies the months from January onwards marked a downturn in their own fortunes that contrasts with the fortunes of the Social Democrats themselves. For the Green Party their share of the averages declines as soon as the Social Democrat’s leadership changes with the 12.0% of January declining to 9.4% in March before reaching a low point of 8.4% in July. The Left Party on the contrary saw an increase to 8.1% in February, but, that ultimately proved to be an erroneous result with their average declining sharply thereafter to a low of 5.8% in June and July. De rödgröna as a whole improved their average to a high of 50.4% in April, owed exclusively to the Social Democrats, but started to decline towards the second half of the the year.
During the months following January the Moderate Party moved downward in the averages arriving at 31.2% in March and onward to 29.1% in June. Their Alliansen allies the remained mostly static during this time period with the only movements of note being a decline of 0.5% for the Centre Party and a modest upward blip for the Christian Democrats in February and March to 4.0% and 3.8% respectively.
The Sweden Democrats started the year with 6.5% in January, that declined in the following months to low points of 5.6% in both March and May but moved upwards towards the second half of the year.
May 2012 saw the publication of the first of Statistics Sweden’s political party preference survey we will deal with during the course of this article. The Results were as follows: Social Democrats 37.3%, Moderate Party 28.6%, Green Party 8.4%, Left Party 5.9%, Liberal People’s Party 5.5%, Sweden Democrats 5.4%, Centre Party 4.7%, Christian Democrats 3.7% and Others 0.8%.[6] This, for the most part, tallies well with the average for May with the largest deviation being the Social Democrats whose score with SCB is 1.8% above the average. This could be accounted for in any number of potential errors present in the five polls from Novus, Demoskop, yougov, TNS-Sifo and United Minds that comprise the May average; although might be the result of more accurate methods on the part SCB, or just simply the result of a more coherent sample as SCB’s survey uses one single methodology in comparison to the different methodologies used by the pollsters in the average.
Into the second half of 2012 we see in the averages a gradual decline for the Social Democrats who move to 34.6% in August, 33.8% in September, 32.8% in October and finally to 32.0% in December. The Social Democrat’s allies experienced a less dramatic change in their fortunes during that time period with the Green Party having a minor increase in their average in August and September to 9.0% and 9.1% respectively before dropping back towards the mid-eight percent range for the remaining three months of the year. The Left Party’s averages deviated even less with an October score of 6.2% being the only change away from 5.8% in the months of June through to December.
For the Moderate Party the second half of 2012 started with a disappointing low of 29.0% in August but improved thereafter with 29.6% in September, 29.8% in October and 30.1% in December. Their Alliansen allies faired much less convincingly with the Liberal People’s Party having a high blip of 6.8% in July followed by a decline down to 5.9%,5.4% and 5.7% in October, November and December respectively. The Centre Party continued their slow drip downwards with the 4.7% recorded in June and July being exchanged for 4.4%, 4.3% and 4.1% in October, November and December; a decline to be made worse by the policy decisions floated by the Centre Party’s leadership.[7] The Christian Democrats continued to stay below the 4% threshold, spending the second half of 2012 hovering with very little movement around 3.5%.
The Sweden Democrats by contrast to the two large blocs experienced an upward surge in popularity moving from the 6.3% of June towards the 8.2%, 8.7% and 9.2% in the last three months of the year. The controversies created by the Sweden Democrat’s MPs didn’t seem to be denting their popularity;[8] perhaps a worrying self-comment on the current state of Swedish society.
The November survey released by SCB contained the following results: Social Democrats 34.8%, Moderate Party 28.1%, Green Party 8.6%, Sweden Democrats 7.9%, Left Party 5.8%, Liberal People’s Party 5.5%, Centre Party 4.4%, Christian Democrats 3.8% and others 1.2%.[9] That result involved a drop of 2.5% for the Social democrats on the May result and an increase of 2.5% for the Sweden Democrats. The largest deviations from the November average were the Social Democrats with a deviation of 1.7% above the average, and the Moderate Party who were 1.6% below their poll average. The deviation on the part of the Moderate Party’s figures might be explained in part by the Christian Democrats who, at 3.8%, are above their poll average by 0.3%. The Sweden Democrats were also below their average by 0.8%, suggesting potential brittleness to their support; though it isn’t impossible that the Swedish public are less inclined to answer with an ‘undesirable’ choice when talking to a public body like the SCB.
TABLE TWO: Monthly polling averages January 2013-December 2013

5. Opinion Polling January 2013 to December 2013
The stories in Swedish politics during the starting months of 2013 including the continued wrestling between the Centre Party’s leadership and its grass-roots; a fight the grass-roots inevitably won, but with a decline to 3.6% by the time of the February average, it might be argued that the damage had already been done.[10][11] Certainly, it set the tone for the Centre Party’s polling experience throughout 2013, the closest they came to the 4% threshold in the first half of the year was a 3.9% result in April, that was repeated in June. The Moderate Party moved downward in the averages at the start of 2013, from the high 30.1% of December they received 29.6% in January, this trend continued throughout the following months with a fall to 28.7% in February and 27.9% in March; At that point the trend abated and they found their average stay steady in the low 28% range during April and May. While it is impossible to be categorical about why the Moderate Party declined in support during the first few months of the year, there is at least an opportunity to speculate that the electoral Strategy of their Christian Democrat allies and the controversial nature of some ministerial proclamations May have taken a toll.[12][13] The Christian Democrats started 2013 with a modest upward swing in support, from 3.6% in December they achieved the heady heights of 3.8% in February. This was something of an illusion though as they soon slipped back in the averages recording 3.6% in both March and April before a low of 3.5% in May; June saw them score an unusually high 3.9%. For the Liberal People’s Party the early stages of 2013 continued their general trend from 2012, namely the hovering in and around the 6% mark, this manifested as a 6.1% in January, 5.6% in February, 6.2% in March and April, 5.8% in May and 6.0% in June.
The Social Democrats, Green Party and Left Party started the year in much the same vain as they’d ended with the Social Democrats themselves declining modestly to 31.8% in January before improving to 32.1% in February, 32.7% in March and 33.0% in April; these figures though started to edge down into May and June with 32.7% and 32.4% respectively. For the Green Party, they stayed around their usual 8.5% mark in January, in fact, they were exactly on that figure; February and March saw a change to this situation with 9.4% and 9.0% respectively. This proved to be a start to a rise in the Green Party’s long-term fortunes with 9.3% in May and a high of 10.0% in June, marred only by a low of 8.7% in April. The Left Party finally started their movement away from the figure of 5.8% with a 5.9% in February, 6.1% in March, 6.2% in April, 6.6% in May and 6.7% in June. The Rödgröna as a whole scored a fairly low 46.1% in January, but, that proved to be a low point with the average rising upwards to 49.1% in June; as can be seen, this was a collective increase on the part of all three parties in the Rödgröna but with the Social Democrats contributing the least to this improvement, possibly owing to the occasional controversy courted by high ranked members and the subsequent reactions by the party.[14]
The Sweden Democrat’s start to 2013 was much the same as their end to 2012 with a rise from December’s 9.2% to 9.8% in January and onward to 10.2% in February. This surge upward, which had been uninterrupted in the averages since it started in June 2012, came to an end in March with a decline to 9.6%, followed by 8.7% in April and May before going upwards again to 9.3% in June. This fall and then rise again in the Sweden Democrat’s fortunes can perhaps be explained by the series of controversies the party had to deal with during that period of time. These controversies included the expulsion of some neo-nazis from the party, a councillor leaving for a neo-nazi party, notably high campaign donations, and the continued saga of former economic spokesman Erik Almqvist.[15][16][17][18]
During May the Stockholm district of Husby was gripped by a nine day long riot sparked off by the shooting dead by Police of an elderly man in his apartment.[19] The shooting inflamed tensions in the district, whose population is predominantly of an immigrant background, tensions perhaps fuelled by the rise in popularity of the Sweden Democrats. Reactions to the riots by the Alliansen parties scarcely acknowledged this however; certainly Swedish prime minister, and Moderate Party leader, Fredrik Reinfeldt wasn’t mincing his words in blaming the rioters themselves.[20]
The May 2013 SCB party preference survey had the following figures: Social Democrats 35.6%, Moderate Party 26.9%, Green Party 8.5%, Sweden Democrats 7.7%, Left Party 6.4%, Liberal People’s Party 6.0%, Centre Party 4.2%, Christian Democrats 3.6% and others 1.1%.[21] This survey sees some fairly large deviations from the average for May; the largest deviation was the Social Democrat’s figure which was 2.9% above the average. This deviation is a sign, if every there was one, that methodology has an important impact on the headline figures; indeed during May the closest pollster to SCB’s figures for the Social Democrats was Skop with 34.2%. Whether SCB are in the right on methodology is ultimately a matter of debate, debate that is likely only to be answered if SCB were to decide to do a survey during the general election campaign, allowing a direct comparison between their results and the officially counted vote.
Moving into the second half of 2013 we see the Social Democrats average remain more or less level with 32.9% in July, 32.5% in August and 32.8% in September. In October the Social Democrats received a high 33.8% which ultimately turned out to be something of an illusion with November and December contributing figures of 33.1% and 33.0%. The Social Democrats positioning in relation to their allies during this time period is arguably more interesting than than the averages with the annual summer political get together in Gotland providing a suggestion from some members of the Social Democrats that they reckon the ex-communist Left Party have moved rightward enough to not warrant a ‘cordon sanitaire’ around them, thus the implication being that the Left Party might find itself in government come the end of September 2014;[22] a more rightward tilting Left Party would jive well with the Social Democrats who have been going further in that direction themselves in recent times.[23] As to the Left Party’s polling averages, they proved to be good for them with the early part of the summer giving them a remarkably high 7.5% in July followed by a lower, but still high in context of their recent averages, 7.0% in August; though it needs to be said that there were only three polls in July and four in August, perhaps giving an explanation as to why they saw these high figures. September brought the Left Party 6.8% with that being followed by 6.4% in October before moving back upwards to 7.1% in November and 7.5% in December. This increase in support could be accounted for by the high profile defection of legal eagle Claes Borgström from the Social Democrats to them.[24] For the Green Party the averages in the second half of the year proved to be quite static with a high of 9.7% in September and a low of 9.1% in October, but generally staying in the mid-nine percent range.
For the Moderate Party the averages showed a steady trend downwards throughout the second half of 2013; a 26.3% in August moved to 25.7% in both September and October and was followed by a 25.3% in October with a low of 24.4% in December. Stories of esoteric usage of government funds might be in part responsible for this slumping.[25] The Liberal People Party, quite like the Green Party, had a very humdrum time in the averages during the second half of the year with a 5.9% of July being followed by 5.8% in September and a low of 5.2% in October before climbing back up again to 6.0% in November and 6.2% in December. The Centre Party and Christian Democrats, who were both below the 4% threshold in the early part of 2013, moved to 4.1% and 4.0% respectively in August. For the Christian Democrats this proved to be something of a blip as they promptly fell back down again to 3.8% in September, 3.7% in October and 3.8% in November before returning to the magic 4% in December with that exact number. The Centre Party’s average moved around quite a lot during the autumn with the 4.1% of August turning into 3.9% in September, then back up to 4.4% in October, down to 4.0% in November and finishing with 3.8% in December.
The Sweden Democrat’s second half of 2013 was one of a small upward swing in their average followed by a steadying; in July they received 10.6%, their highest average to date, it was an abrupt upsurge not repeated in August when they fell to 9.3%. The real movement up in their average happened in September when they received 10.1%, followed by 10.4% in October and 10.0% in November before ending at 10.2% in December. This period of time included a fairly substantial amount of attention for the Sweden Democrats, mostly of an unfavourable nature. In August they received a rebuke from their counterpart in Denmark, the Danish People’s Party, for co-operating with the French National Front.[26] This was followed later in November by Sweden Democrat leader Jimmie Åkesson being hit with a cake while at a book signing;[27] the Swedish secret police, SÄPO, even saw fit to launch an investigation into that.[28]During December a Sweden Democrat politician in Malmö had an explosive device detonated outside his apartment blowing the apartment’s door off its hinges; this perhaps shows volatility amongst those opposing the Sweden Democrat‘s xenophobia[29]. Also in December there was a mass anti-racism protest in Kärrtorp, while not directly related to the Sweden Democrats it could be argued that the xenophobic campaigning of the Sweden Democrats has emboldened the more hard-line neo-nazis whose disruption of a previous demonstration was the reason for the protest in Kärrtorp.[30]
Results of the SCB political party preference survey for November 2013: Social Democrats 34.3%, Moderate Party 25.5%, Sweden Democrats 9.3%, Green Party 8.8%, Left Party 6.7%, Liberal People’s Party 5.4%, Centre Party 4.7%, Christian Democrats 4.1% and others 1.3%.[31] There are significant deviations for the Social Democrats and Centre Party between SCB’s survey and the polling average, these deviations are for the Social Democrats 1.2% and for the Centre Party 0.7%. I don’t think it’s much of an outrage to be suggesting that as we get closer to the Swedish general election in September 2014 we will see a moving upwards of the vote of both of these parties as people start clarifying their political choices in the own minds, the historic electoral pedigree of these two parties inevitably will weigh heavily on the minds of the Swedish electorate; they scored a collective 68.66% of the vote in 1973. All of the SCB surveys are released with a flow chart giving a good impression of where a party’s support either comes from or is going to; the flow chart for the November survey shows that for the Social Democrats their increase in support from the 2010 general election is mainly the result of a transfer of 1.9% from the Moderate Party and of 1.0% from the Liberal People’s Party. In contrast the Social Democrats are losing support to the Sweden Democrats, while the Greens are losing support to both the Social Democrats and Left Party whilst gaining it from the Alliansen parties. The Christian Democrats lose support to the Social Democrats, Moderate Party and Sweden Democrats almost in equal quantity; the Centre Party are the sufferers of a similarly equal distribution of their losses with the largest share heading to the Social Democrats. The consequence of these figures would be that if current Social Democrat voters decide to change their mind then the primary beneficiaries would likely be the Alliansen parties.[32]
6. Opinion Polling January 2014
January 2014 saw the continuation of the trends we have observed during the latter half of 2013, the figures are as follows: Social Democrats 33.0%, Moderate Party 24.7%, Sweden Democrats 10.0%, Green Party 9.3%, Left Party 7.8%, Liberal People’s Party 5.9%, Centre Party 4.2%, Christian Democrats 3.5% and others 1.4%. All eight Swedish commercial pollsters polled during the course of January giving us the opportunity to compare the pollsters to each other, a comparison that puts meat of the bone of the argument that methodology and margin of error are an important consideration when evaluating an individual opinion poll. For the Social Democrats January’s polls contained a low of 31.5% from Sentio and a High of 34.7% from Demoskop. Demoskop’s figure for the Social Democrats is contrasted with their low figure for the Moderate Party of 22.3%; the high for the Moderate Party being 27.2% from Skop. For the Green Party their low was a 7.9% which came from Yougov and their high was an 11.1% that came from Demoskop. The Sweden Democrats received their best result from Sentio with 13.7%, this contrasted with a low of 7.3% from Ipsos. For the Left Party Ipsos offered up their best result with 9.1% while Demoskop gave them their low of 6.5%. For the Liberal People’s Party the low was 5.1%, which came from Novus, and the high was 6.5%, which came from TNS-Sifo. General agreement seems to reign between the pollsters for the Christian Democrats with a low of 3.1% from Skop and a high of 4.3% from Yougov; though Yougov are out on their lonesome with the next highest being Sentio with only 3.7%. By contrast the Centre Party was subject to a much wider variety with a low of 3.1% and a high of 5.2%; though there were three results of 4.5% and one of 4.6%, which could be taken as indicating a certain amount of agreement. All in all it isn’t difficult to look at those figures and come out with the conclusion that an individual pollster’s polls are subject to natural variation as a result of the methodologies and sample sizes used; something which should always be taken account of by journalists when reporting on polls, but which rarely is, a shame really.
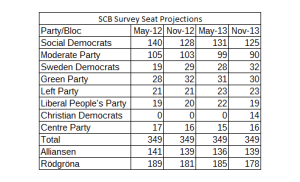
TABLE THREE: SCB Survey Seat Projections
 7. Projected Election Results based on SCB Surveys

It’s probably not a great idea to include this section given prior comments I myself have made about the inaccuracies present in any and all projected election results, but since I’ve written extensively about abstract percentages in the previous sections I thought it would be useful to give concrete examples as to what those percentages would mean in the context of the Swedish Parliamentary and electoral set up. As such, I’ve chosen to make four projections, each based on the SCB political party preference surveys from May 2012, November 2012, May 2013 and November 2013. The spreadsheet used to make these projections is linked to in the References.[33]
As can be seen from the contents of table three, the Rödgröna have been projected to take a majority of seats in the Riksdag in all four of the SCB surveys released during the time period which we have been examining; indeed the Social Democrats were projected off the back of the 37.3% in the May 2012 survey to take a substantial 140 seats by themselves alone, though this did move downwards as their survey scores diminished. While the Centre Party found themselves below the 4% threshold many times in the polls conducted by the commercial pollsters they never found themselves below it in SCB’s surveys; though the results still signified a loss on the previous general election result. The Christian Democrats were not as lucky as the Centre Party and it was only in the November 2013 survey that they managed to work their way back above that 4% threshold; the consequences of this theshold can be seen by comparing the projected result for November 2013 when they scored 4.1% and 14 seats against the result for November 2012 when they scored 3.8%, only 0.3% less, but received zero seats. The only other results of note were the Moderate Party’s percentages taking them below 100 seats in May and November 2013, and, the Sweden Democrats turning the 19 seats of May 2012 into the 29 seats of November 2012; the difference in percentage being only 2.5%.
That concludes this examination of Swedish polling and politics, I hope this article was illuminating for those that have read it and that my facts and style are up to the expected standards; if not, do feel free to comment, I’d be more than happy to make corrections. Below you will find a table containing all the opinion polls I’ve recorded as having been conducted in Sweden during the time period examined along with a list of References used during the course of the article.
TABLE FOUR: Complete list of Polls January 2012-January 2014

REFERENCES:
[1]http://www.val.se/val/val2010/slutresultat/R/rike/index.html [Swedish]
[2]http://www.val.se/val/val2010/slutresultat/R/rike/valda.html [Swedish]
[3]http://www.nsd.uib.no/european_election_database/country/sweden/parliamentary_elections.html
[4] http://sverigesradio.se/sida/artikel.aspx?programid=2054&artikel=4922085
[5] http://sverigesradio.se/sida/artikel.aspx?programid=2054&artikel=4930367
[7]http://sverigesradio.se/sida/artikel.aspx?programid=2054&artikel=5394222
[8]http://sverigesradio.se/sida/artikel.aspx?programid=2054&artikel=5345662
[10]http://sverigesradio.se/sida/artikel.aspx?programid=2054&artikel=5399540
[11] http://sverigesradio.se/sida/artikel.aspx?programid=2054&artikel=5446931
[12] http://sverigesradio.se/sida/artikel.aspx?programid=2054&artikel=5422606
[13] http://sverigesradio.se/sida/artikel.aspx?programid=2054&artikel=5430404
[14] http://sverigesradio.se/sida/artikel.aspx?programid=2054&artikel=5505638
[15] http://sverigesradio.se/sida/artikel.aspx?programid=2054&artikel=5477714
[16] http://sverigesradio.se/sida/artikel.aspx?programid=2054&artikel=5556268
[17] http://sverigesradio.se/sida/artikel.aspx?programid=2054&artikel=5512574
[18] http://sverigesradio.se/sida/artikel.aspx?programid=2054&artikel=5520382
[19] http://sverigesradio.se/sida/artikel.aspx?programid=2054&artikel=5539205
[20] http://sverigesradio.se/sida/artikel.aspx?programid=2054&artikel=5541318
[22] http://sverigesradio.se/sida/artikel.aspx?programid=2054&artikel=5585345
[23] http://sverigesradio.se/sida/artikel.aspx?programid=2054&artikel=5624604
[24] http://sverigesradio.se/sida/artikel.aspx?programid=2054&artikel=5699706
[25] http://sverigesradio.se/sida/artikel.aspx?programid=2054&artikel=5654713
[26] http://sverigesradio.se/sida/artikel.aspx?programid=2054&artikel=5703429
[27] http://sverigesradio.se/sida/artikel.aspx?programid=2054&artikel=5695774
[28] http://sverigesradio.se/sida/artikel.aspx?programid=2054&artikel=5696020
[29] http://sverigesradio.se/sida/artikel.aspx?programid=2054&artikel=5737287
[30] http://sverigesradio.se/sida/artikel.aspx?programid=2054&artikel=5741393
[32] http://www.scb.se/Statistik/ME/ME0201/2013M11/Figur1_EN.png
[33] https://sevenherring.files.wordpress.com/2014/02/sweden-parliament.xlsx
